11 Exclusive Reports in your Education CRM
by Priyalshri Chattar | Feb 12, 2024 | ExtraaEdge’s Blog

The potential of your education CRM isn’t just having a laundry list of reports at your disposal. It’s about grasping why these reports matter and how they can propel your institution’s success to new heights.
Let’s understand this with the most entertaining brand’s story – Netflix
The rise of Netflix from a humble DVD rental service to a streaming giant wasn’t just luck or guesswork.
In the early 2000s, when faced with fierce competition and the looming shadow of Blockbuster, Netflix didn’t rely on gut feelings or outdated market research. Instead, they dove headfirst into a world of data, uncovering intricate details about their subscribers’ viewing habits.
They didn’t just stop at what people were watching; they delved into when, for how long, and crucially, when they hit pause for good.
Now, let’s bring this home to your institution.
Imagine if you could peer into the minds of your prospective students, understanding their every move as they navigate your application process.
Are they breezing through effortlessly, or are they hitting roadblocks along the way?
And what about your counsellors? How effective are their interactions with potential students? Do they follow up promptly, or are there leads slipping through the cracks?
What to do with these numbers?
In 2013, Netflix debuted “House of Cards” after analyzing data indicating fans of the British version also liked David Fincher films and Kevin Spacey. The show’s triumph spurred Netflix to create more original content like “Stranger Things,” “Orange is the New Black,” and “The Crown.”
Netflix’s data-driven approach to content creation disrupted the entertainment industry and changed how content is produced and consumed. By leveraging data to understand audience preferences and behaviour, Netflix was able to create highly engaging and successful original content that resonated with viewers worldwide.
In this era of data-driven decision-making, the parallels between Netflix’s success story and your institution’s journey are clear.
It’s not just about having data; it’s about harnessing it to sculpt personalized experiences, drive engagement, and propel your institution forward.
So, buckle up as we delve into the 11 exclusive reports in your education CRM and uncover how they can revolutionize your approach to student recruitment and engagement.
Unveiling the 11 Exclusive Reports in your Education CRM
1. Funnel-wise Application Drop
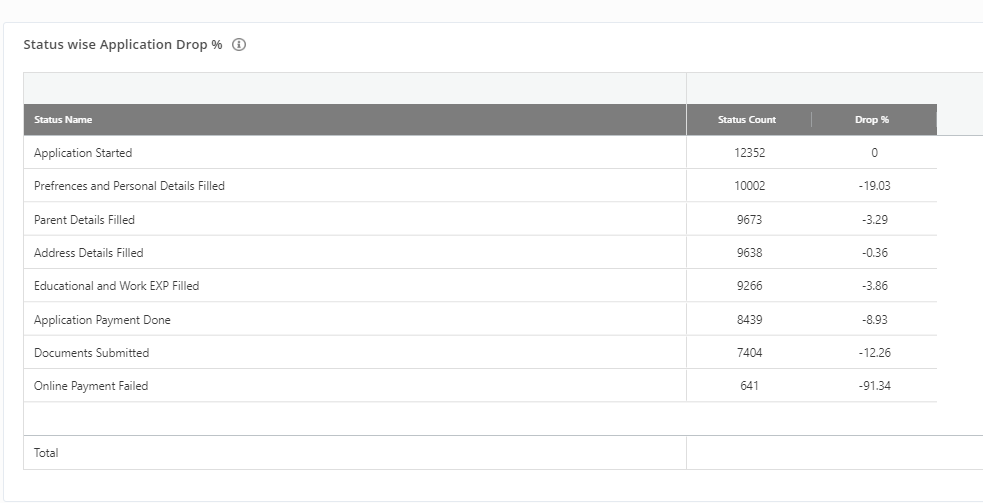
The “Funnel-wise Application Drop Analysis” report provides valuable insights into the various stages of the application process where the most significant drop-offs occur. By examining each stage of the application funnel, you can pinpoint bottlenecks and inefficiencies, allowing for targeted interventions to streamline the process and improve overall conversion rates.
What can you do with this data?
- Identify application funnel bottlenecks for focused efforts.
- Implement interventions to address application drop-off root causes.
- Streamline the application process for improved efficiency.
- Utilize predictive analytics for proactive strategy adjustments.
2. Lead to Application Conversion Analysis

The “Lead to Application Conversion Analysis” involves tracking the rate at which leads generated through marketing efforts, publishers or other outreach channels progress into actual submitted applications. This analysis provides valuable insights into the effectiveness of marketing strategies, lead nurturing efforts, and overall enrollment management practices.
What can you do with this data?
- Analyze conversion rates for strategic resource allocation.
- Address lead nurturing bottlenecks for seamless enrollment.
- Segment communication for better engagement.
- Optimize timing and frequency of communication touchpoints.
3. Registration to Enrollment Analysis Report
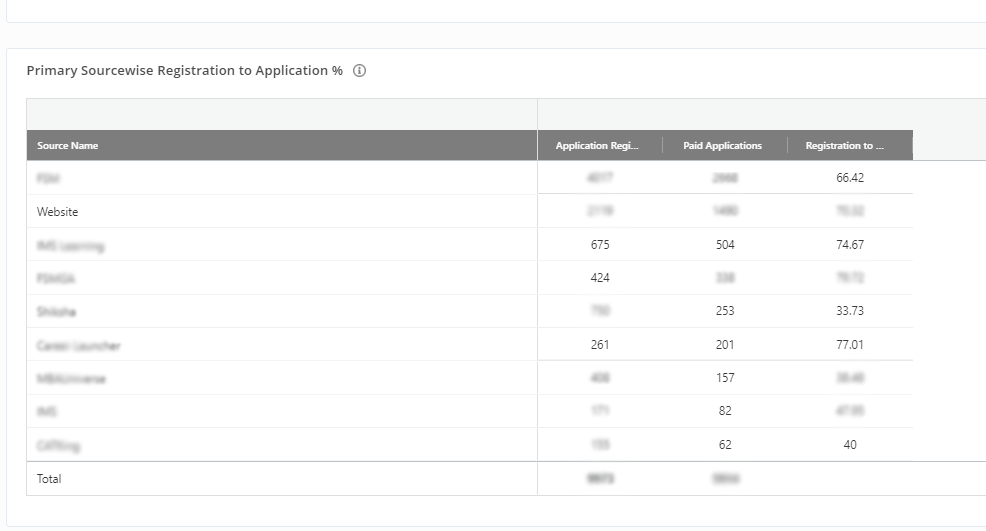
This report provides a comprehensive overview of registration to enrollment data, offering insights into trends, patterns, and performance metrics related to student registration and enrollment processes within an educational institution.
What can you do with this data?
- Optimize course offerings to meet student demand.
- Streamline registration procedures for efficiency.
- Forecast enrollments for resource allocation.
- Enhance student services with registration insights.
4. Top-Performing Channels
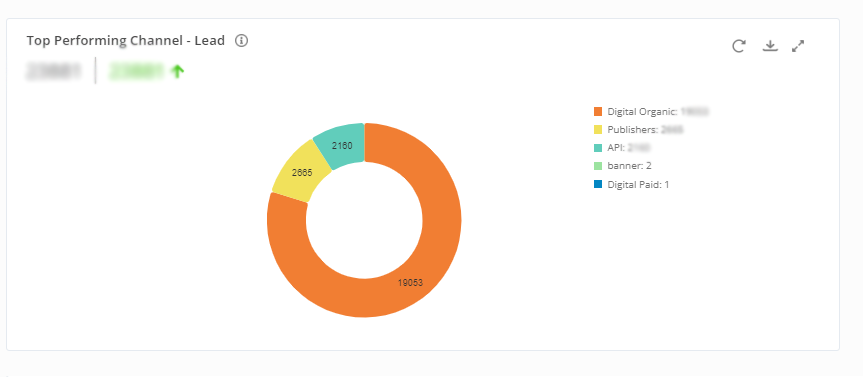
This report provides a detailed analysis of various marketing and communication channels, highlighting the top-performing channels based on metrics such as engagement, conversion rates, and return on investment (ROI). It offers insights into the effectiveness of different channels in reaching and resonating with target audiences.
What can you do with this data?
- Allocate budgets to high-return channels.
- Tailor messaging to top-performing channel audiences.
- Reallocate resources to better-performing channels.
- Measure campaign impact to refine future strategies.
5. Paid vs. Unpaid Applications Report
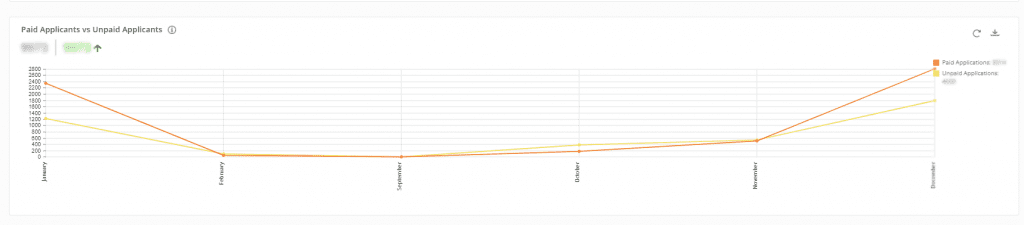
This report presents a comparative analysis of paid and unpaid applications, examining factors such as application volume, quality, and conversion rates. It offers insights into the effectiveness of different application acquisition strategies and their impact on overall recruitment efforts.
What can you do with this data?
- Optimize recruitment budgets by identifying high-quality acquisition methods.
- Refine marketing to target demographics based on successful channels.
- Implement incentives for paid applications to increase volume.
- Measure the long-term value of paid versus unpaid applicants.
6. Analysis of the Student Quality Index Report
This report offers a comprehensive analysis of the Student Quality Index, which assesses various factors such as academic performance, extracurricular involvement, diversity, and other indicators of student excellence. It provides insights into the overall quality and diversity of the student body, aiding in strategic decision-making and academic planning.
What can you do with this data?
- Tailor recruitment strategies for high-quality candidates based on Student Quality Index factors.
- Enhance academic programs to improve student quality and diversity.
- Benchmark against peers to identify areas for improvement.
- Collaborate with student organizations for a diverse campus environment.
7. Daily Performance Analysis
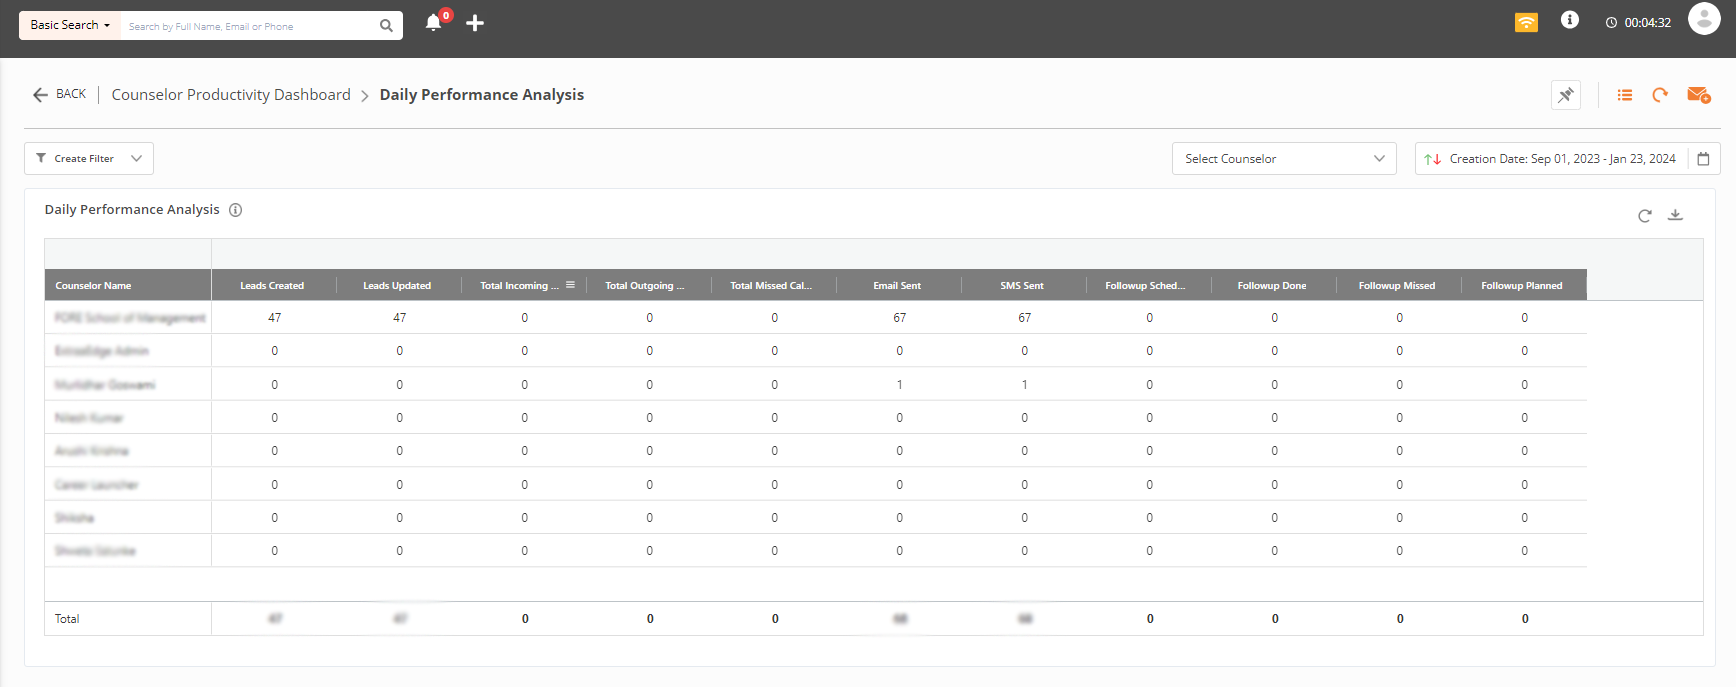
This report provides a detailed breakdown of daily performance metrics, including the counselor’s name with respect to the number of leads created, total outgoing and incoming communications (such as emails and SMS), total follow-ups conducted, and follow-ups missed. It offers insights into the efficiency and effectiveness of daily operations related to lead generation and communication.
What can you do with this data?
- Identify peak performance days and times for resource optimization.
- Evaluate communication channels’ effectiveness in engaging leads.
- Identify and address follow-up process bottlenecks for improved conversion.
- Measure daily operations’ impact on sales, informing strategic decisions.
8. Publisher Dashboard
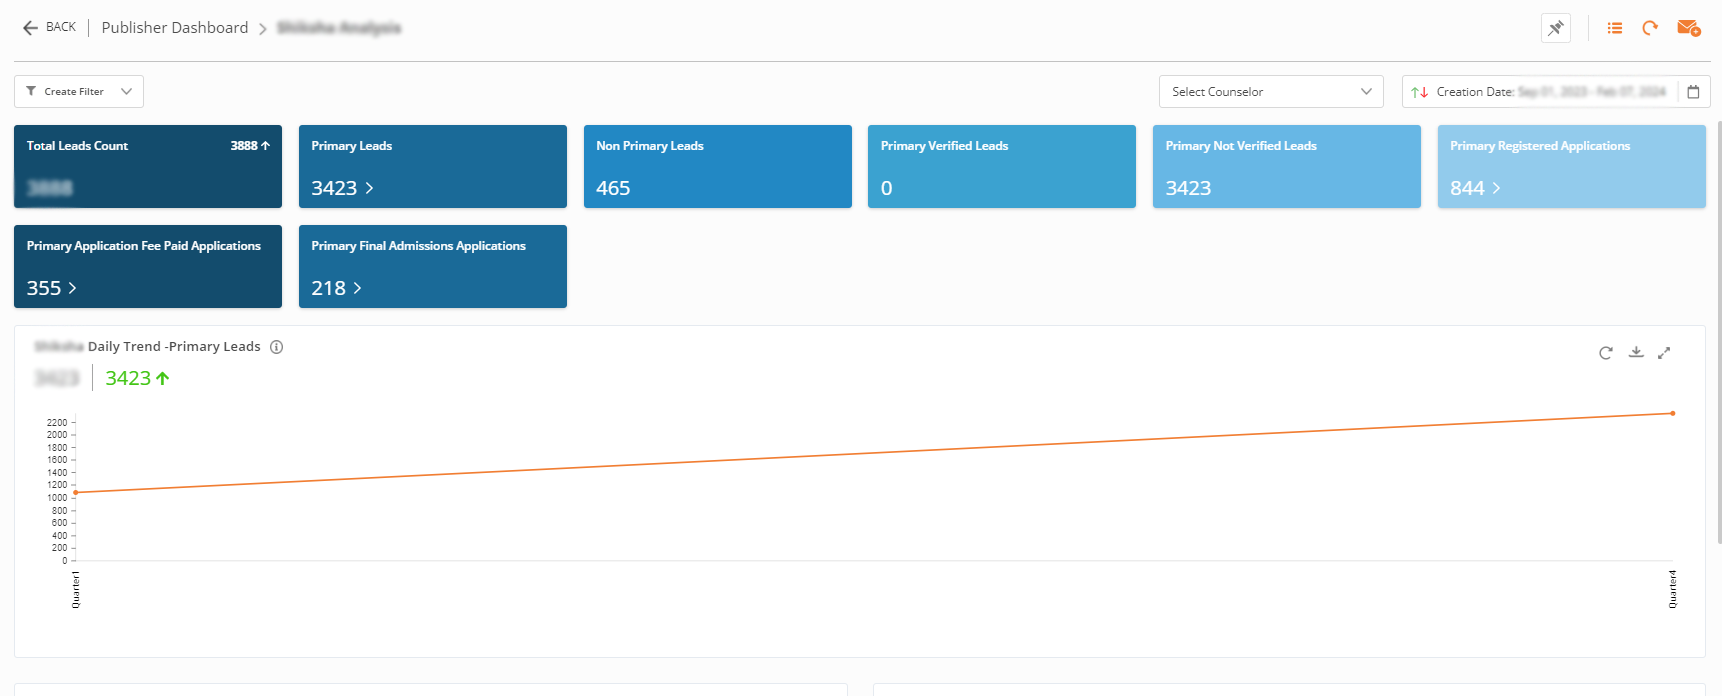
The Publisher Dashboard offers publishers vital insights into lead generation, application initiation, and enrollment. It provides a comprehensive overview of their efforts, enabling them to optimize strategies and enhance conversion rates effectively.
What can you do with this data?
- Identify high-performing publishers to allocate resources effectively.
- Evaluate publisher partnerships for future collaboration decisions.
- Implement campaigns or incentives for lead generation.
- Collaborate with top publishers for customized recruitment plans.
9. Benchmarking Application Projection Report
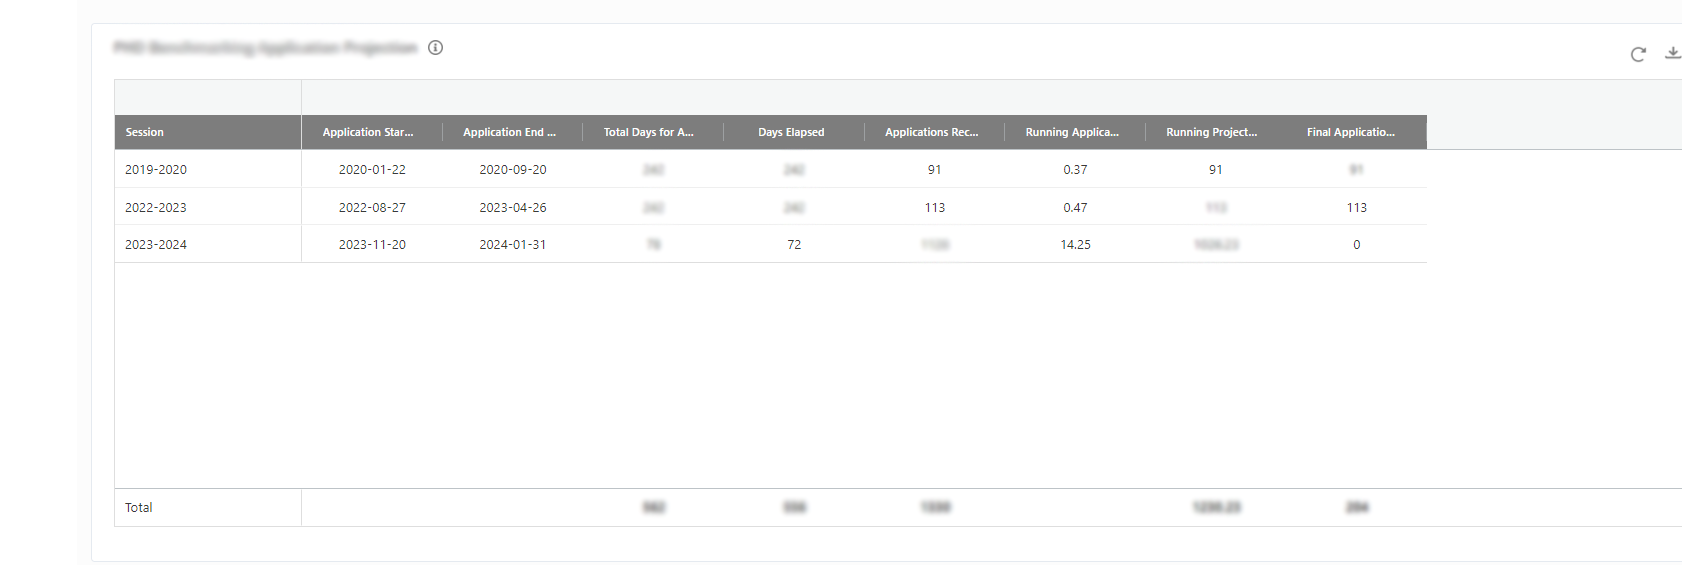
This report utilizes historical data to forecast future admissions, providing institutions with valuable insights to set realistic goals and allocate resources effectively. It enables informed decision-making and strategic planning for admissions management.
What can you do with this data?
- Align enrollment targets with projected applications for optimal resource allocation.
- Adjust recruitment strategies based on enrollment trends for desired demographics.
- Allocate resources according to projected application volumes for efficient admissions.
- Adjust strategies based on external factors to maintain competitiveness.
10. Counselor Productivity Dashboard
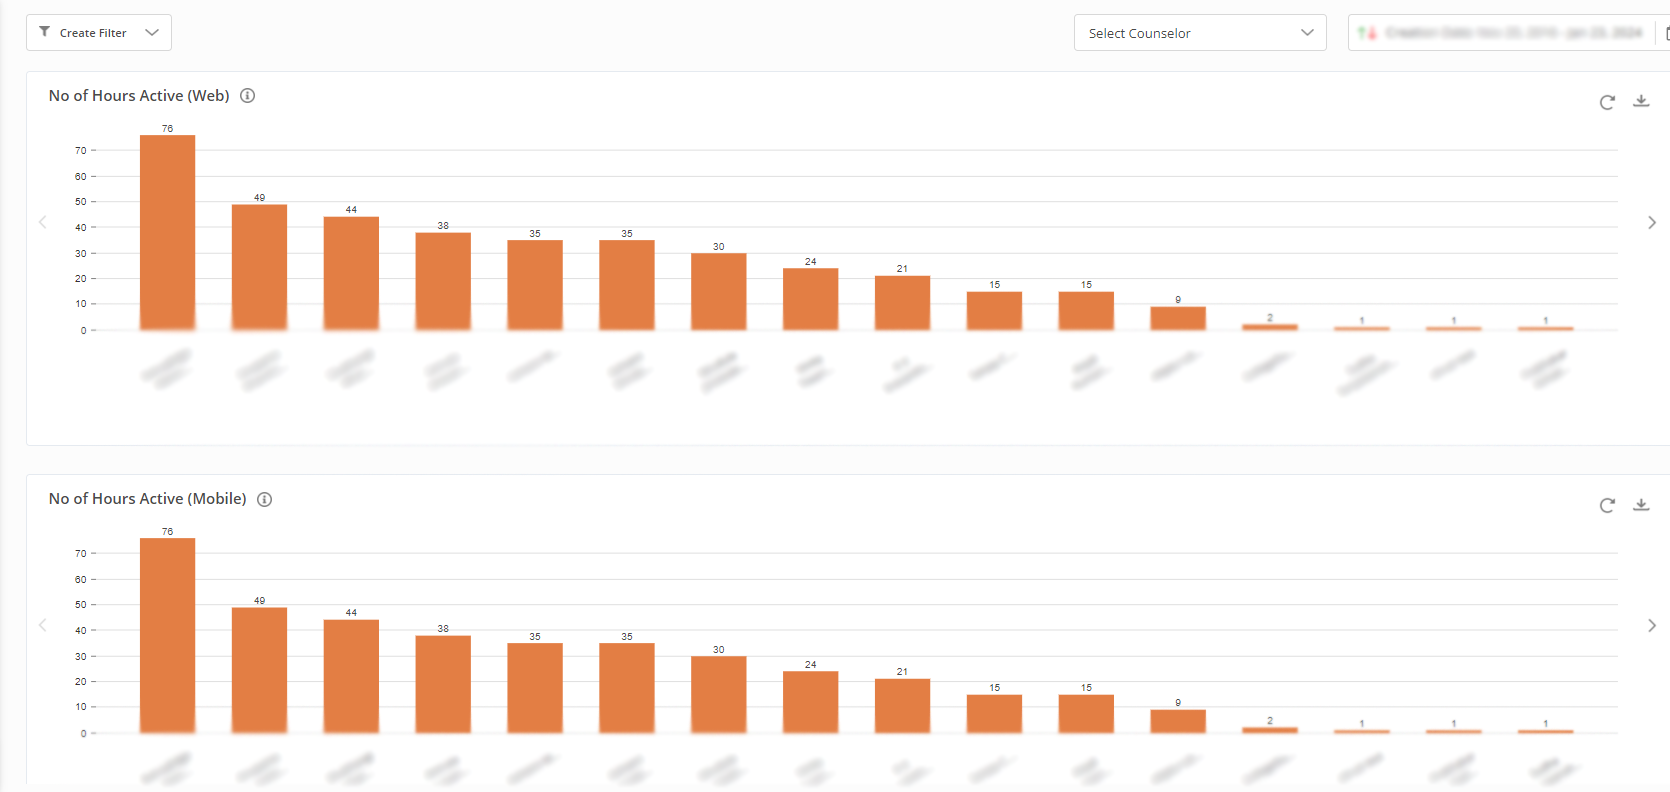
This dashboard provides real-time monitoring of counsellor productivity, tracking average hours worked, login/logout times, and active time. It offers valuable insights into counsellor efficiency and workload management in your institute.
What can you do with this data?
- Optimize counsellor schedules for efficient resource use.
- Improve staffing allocation based on counsellor availability trends.
- Enhance counsellor accountability by monitoring activity.
- Implement targeted training based on productivity data.
11. Facebook Campaign Analysis
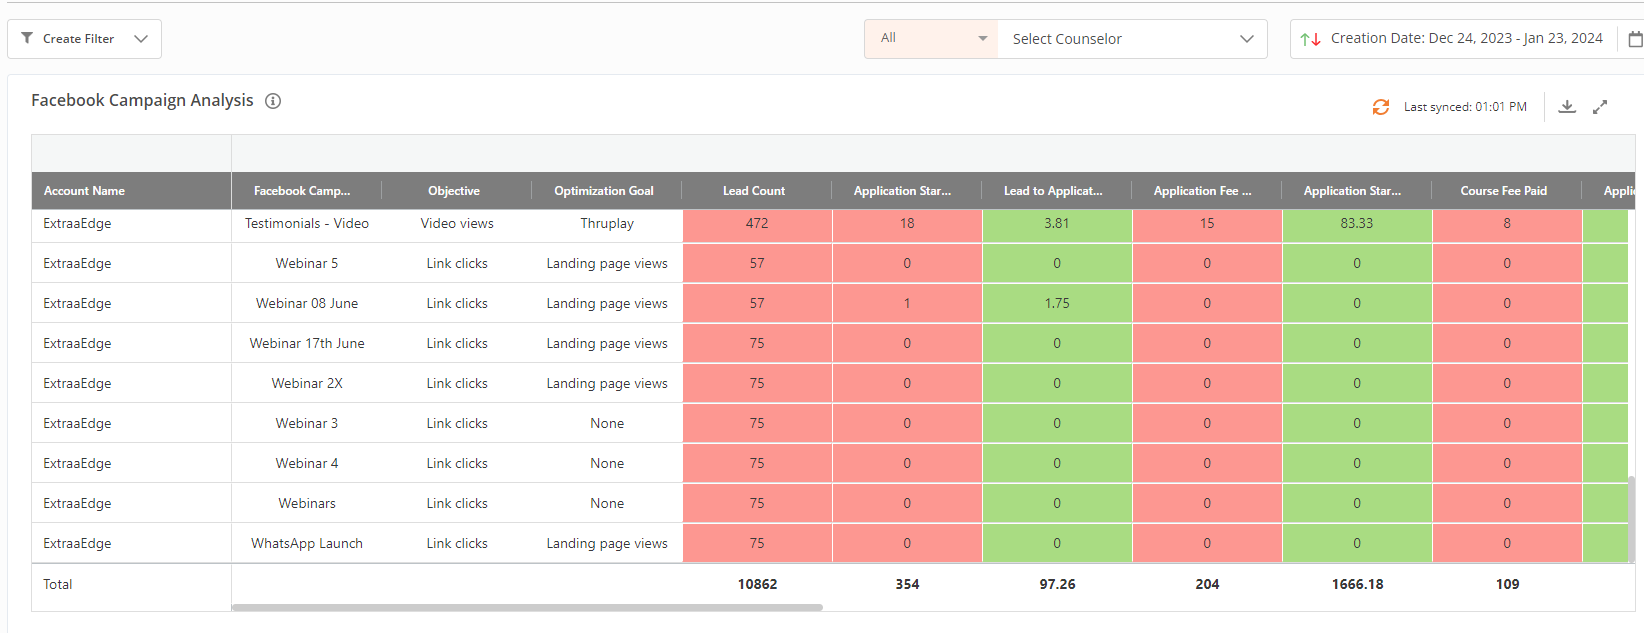
This report evaluates the performance of Facebook campaigns in student recruitment, focusing on audience engagement and campaign effectiveness. It tracks metrics such as the total number of leads generated and the stage of enrollment each student is in.
What can you do with this data?
- Implement retargeting strategies to drive conversions at different enrollment stages.
- Refine targeting strategies based on campaign performance insights.
- Identify audience engagement trends to enhance campaign performance.
- Evaluate the ROI of Facebook campaigns using lead and enrollment data.
Conclusion: Empowering Enrollments Through Data
As educational paradigms continue to evolve, the importance of data-driven insights cannot be overstated. Embracing technology and harnessing the potential of education CRM systems and associated reports will not only empower institutions to thrive but also contribute to the holistic development of students in the ever-changing educational landscape.
The adoption of a Compatible Education CRM and the utilization of its comprehensive reports are indispensable for modern educational institutes. By leveraging the power of data analytics, you can make informed decisions, streamline processes, and ultimately provide a more enriching enrollment experience for students.
ExtraaEdge excels at understanding admissions workflows and tailoring reports to meet specific needs. Our comprehensive suite of reports empowers teams with actionable insights for data-driven decisions, enhancing enrollment outcomes. Through innovation, ExtraaEdge ensures compatibility with evolving educational paradigms, providing a competitive edge for institutions in today’s dynamic landscape.
Related Blog


Join 30,000+ admission & marketing experts
Sign up for our weekly updates regarding education marketing, admission technologies & product updates.